
| Capital at risk. All investments involve risk and investors may not get back the amount originally invested. |
Asset allocators have struggled with how to address Japan in recent decades. The market is simply too big to ignore, and too variable to approach with a persistent style preference. Exaggerated and unpredictable style swings have been a built-in feature that have caused headaches for many. However, active managers in Japan have delivered what their counterparts elsewhere have failed to provide.
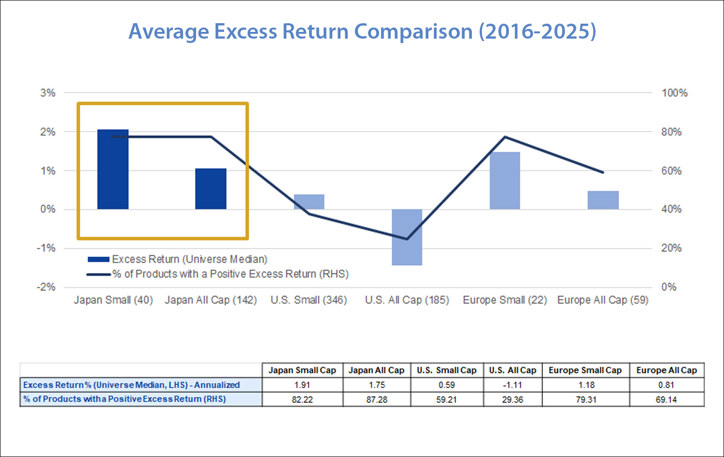
Data from multiple sources tells a clear story about active managers and their relative performance across different markets. As can be seen in a subsequent chart, data available through eVestment shows:
- Average annualized excess returns for Japanese all-cap strategies between 2016 and 2025 stands at an impressive 1.75%.
- In comparison, US all-cap strategies over the same period have yielded an underwhelming -1.11% of excess returns.
- Likewise, studies conducted by the Japanese securities regulator, the Financial Services Agency, and recent allocation decisions by Japan’s Government Pension Fund have come to similar conclusions about the relative merits of active management in Japanese equities
This paper examines some key reasons for this phenomenon and outlines the advantages of a ‘core’ approach to mitigate style risk within the Japanese equity universe.
With our thanks to Jack…
There can be no doubt that the passive investing revolution started by Jack Bogle at Vanguard has changed the asset management landscape forever, and in many ways for the better. When the first index fund was launched by Jack in 1976, few would have predicted the idea would go on to transform investing to the degree it has.
Investors today, regardless of whether they personally invest in passive strategies, can thank Jack indirectly for helping to lower fees, raise levels of competition, and for having a wider range of ways to gain exposure to various themes and geographies in their portfolios.
However, whilst the rise of passive has added a great deal to the allocator’s options, it should arguably be used selectively to take account of the particular characteristics of each market. As we aim to show in this paper, active has significant advantages over passive when it comes to the Japanese market.
What’s different about Japan?
In at least one respect the Japanese stock market presents a much broader opportunity set compared to the UK or some other Western markets. Contrary to the UK, where a long-running public debate over the stagnation of London’s venerable exchange in terms of both the draught of IPOs and the rising tide of delistings shows no signs of getting better any time soon, the Japanese public market is a very different proposition. With a total listed universe of nearly 4,000 companies, Japan’s public equity markets abound with opportunities.
As the chart below shows, over 95% of listed companies are small- and mid-sized, representing around 40% of market cap and a wealth of opportunities for active stock-pickers.
Japan Equity Breakdown
| Markets | Market Cap (JPY tln) | Market Cap Weight | Number of Index Members | Index Member Weight |
|---|---|---|---|---|
| All Markets | 988.4 | 100.0% | 3,829 | 100.0% |
|
Large Cap Market Total (TOPIX 100 Index) |
606.7 | 61.4% | 100 | 2.6% |
| Mid Cap Market Total (TOPIX 400 Index) |
260.1 | 26.3% | 400 | 10.4% |
| Small Cap Market Total (Including all listed issues other than TOPIX100 and TOPIX400 components) |
121.6 | 12.3% | 3,329 | 86.9% |
Source: Bloomberg, as at end of January, 2025
Risk warnings: Past performance is not a reliable indicator of future performance and may not be repeated
However, a logical consequence of this flourishing of listings is that both buy- and sell-side coverage remains patchy, with over two thirds of the almost 4,000 listed companies having one or zero sell-side analysts covering them according to Bloomberg data as at 31 March 2025.
This means that numerous attractive opportunities exist where active managers can uncover specific names well in advance of the wider market registering the positive case. This gives active managers in Japan a structural advantage over their peers in other developed markets who have to fish in a relatively smaller pond and therefore find it much harder to beat the market consensus.
As the graphic below sourced from eVestment shows, average annualised excess returns for managers in the Japanese market have been considerably better than those of managers focused on the US or European markets.
Risk warnings: Past performance is not a reliable indicator of future performance and may not be repeated
The consistent presence of significantly higher excess returns in the Japanese market reinforces the intuitive insight that if a market is structurally inefficient, active managers will have much more room to squeeze out alpha.
A plausible conclusion is that amongst developed market equities, whilst passive investing may be suitable in the US market, analysis using eVestment data on active managers shows that Japanese managers consistently deliver alpha. We attribute this to Japan being a relatively inefficient market in comparison to Europe, the UK, or the US in particular.
How to gain exposure to Japan if passive won’t cut it?
As the world’s third largest national stock market, Japan can fairly be described as unignorable. However, allocating to Japan has over past decades been complicated by the history of the past 3 decades. Allocators to Japan have traditionally had several key questions they need to answer – to themselves, to their investment committee, and most importantly to their clients. These questions are:
- Do I want to be active or passive?
- Do I want to express a view about value vs growth?
- What strategy would be most appropriate to encapsulate my answers to the two questions above?
As we aim to demonstrate in this paper, the questions above can plausibly be answered as follows:
- There are clear reasons why active is more appropriate for Japan than passive
- A so-called ‘core’ approach can provide a robust answer to the question of style and factor exposure.
A plausible conclusion is that amongst developed market equities, whilst passive investing may be suitable in the US market, analysis using eVestment data on active managers shows that Japanese managers consistently deliver alpha. We attribute this to Japan being a relatively inefficient market in comparison to Europe, the UK, or the US in particular.
Risk warnings: Past performance is not a reliable indicator of future performance and may not be repeated.
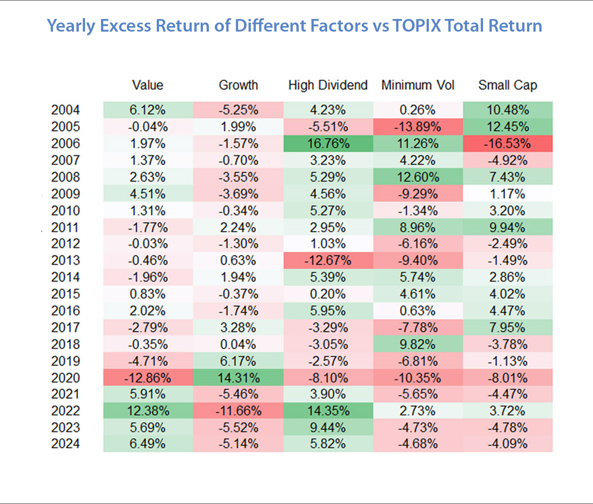
A key point to take away from this table is that while the value and dividend factors have tended to work well in Japan over time, it’s difficult to pin down two crucial things:
- Close correlations of when one factor succeeds at the expense of another are extremely hard to identity in real time
- Rotation points have tended to reoccur periodically but irregularly which tip returns out of a pattern that may have been established for several years.
One such seemingly illogical rhythm present in the data is that the steady period of weak performance seen by value from 2017 to 2021 has since reversed sharply. This occurred in a moment when globally growth stocks were ascending, and yet Japanese growth stocks actually went into decline.
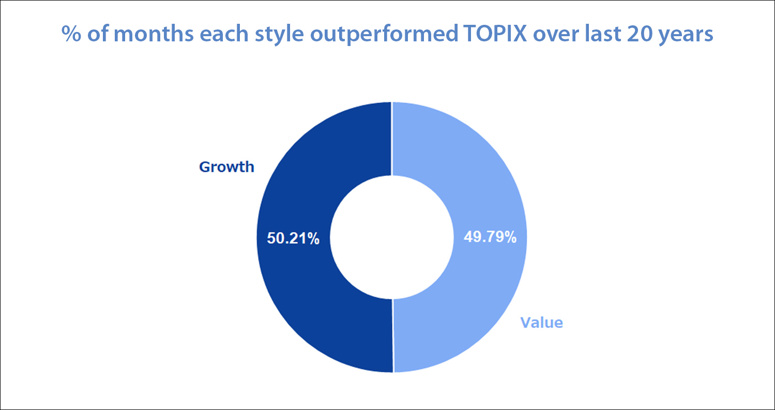
Instead of factor tilts, the ‘core’ approach tends to focus on business fundamentals, especially the earnings and operational side and the perception gap around market expectations. This potentially allows stock selection to drive the excess return, whilst removing some style exposure risk. Interestingly, whilst the superiority of value over growth or vice versa, appears to be unpredictable over any given short-term timeframe, the picture changes dramatically as the timeframe is expanded.
In this way, ‘core’ can be seen as a way of preventing style exposure from adding marginal risk potentially in excess of marginal returns. A ‘core’ portfolio therefore can almost be thought of as an improved version of an “enhanced index” able to capture returns from wherever they occur whilst minimizing factor risk.
As the chart below shows, when viewed in long-term perspective the absolute necessity of having exposure to both is readily apparent.
Value = Russell Nomura Value Gross – TOPIX Total Return
Growth = Russell Nomura Growth Gross – TOPIX Total Return, Data 2004/12 – 2024/12 yearly.
Risk warnings: Past performance is not a reliable indicator of future performance and may not be repeated
As such, we could say that a short-term or tactical approach to factor-based investing has worked very well in Japan… right up until the moments when it didn’t, and these moments repeated periodically and with limited advanced warnings. Meanwhile, a ‘core’ approach could have been successfully harvesting excess returns regardless of which way to wind was blowing on an ongoing basis.
For this reason, we argue a ‘core’ approach can convincingly answer the style and factor exposure questions stated above that an investor interested in allocating to Japan would want to answer.
Drawing it all together – getting comfortable with market inefficiencies
The fundamental drivers of inefficiency in the Japanese equity market are well-known. Japan is a large – too large – market of under-researched, often under-valued stocks with high retail participation and many listed companies that lack independent directors or management teams that focus on shareholder returns.
However, for these reasons Japan is a paradise for active stock pickers; as shown in the eVestment data above, active managers have consistently delivered alpha where their peers elsewhere operating in more efficient markets have failed to do so.
We have also outlined the main reasons why investors might prefer active exposure to passive in this particular market, and we have argued that the problem of picking a style can be circumnavigated with a ‘core’ approach.
Invest with us
If you have any account or dealing enquiries, please contact BBH using the following contact details:
Brown Brothers Harriman (Luxembourg) S.C.A.
80, route d’Esch, L-1470 Luxembourg
T: +352 474 066 226
F: +352 474 066 401
E: Lux.BBH.Transfer.Agent@BBH.com

Richard HAXE
Managing Director, Head of Business Development

Alex BARRY
Executive Director, Head of Distribution - UK and Ireland

Chloé CHOQUIN
Director, Business Development & Client Relations

Thomas CARTWRIGHT
Director, Business Development & Client Relations
|
Disclaimer An investment’s value and the income deriving from it may fall, as well as rise, due to market and currency fluctuations. Investors may not get back the amount originally invested. The information on this website is not intended to be investment advice, tax, financial or any other type of advice, and is for general information purposes only without regard to any particular user's investment objectives or financial situation. The information is educational only and should not be construed as an offer, solicitation, or recommendation to buy, sell, or transact in any security including, but not limited to, shares in any fund, or pursue any particular investment strategy. Any forecasts, figures, opinions or investment techniques and strategies set out are for information purposes only, and are based on certain assumptions and current market conditions that are subject to change without prior notice. The views of Sumitomo Mitsui DS Asset Management (UK) Limited reflected may change without notice. In addition, Sumitomo Mitsui DS Asset Management (UK) Limited may issue information or other reports that are inconsistent with, and reach different conclusions from, the information presented in this report and is under no obligation to ensure that such other reports are brought to the attention of any recipient of this report. Decisions to invest in any fund are deemed to be made solely on the basis of the information contained in the prospectus and the PRIIPS KID accompanied by the latest available annual and semi-annual report. |